Climate change lecture addresses increasing issue
April 26, 2016
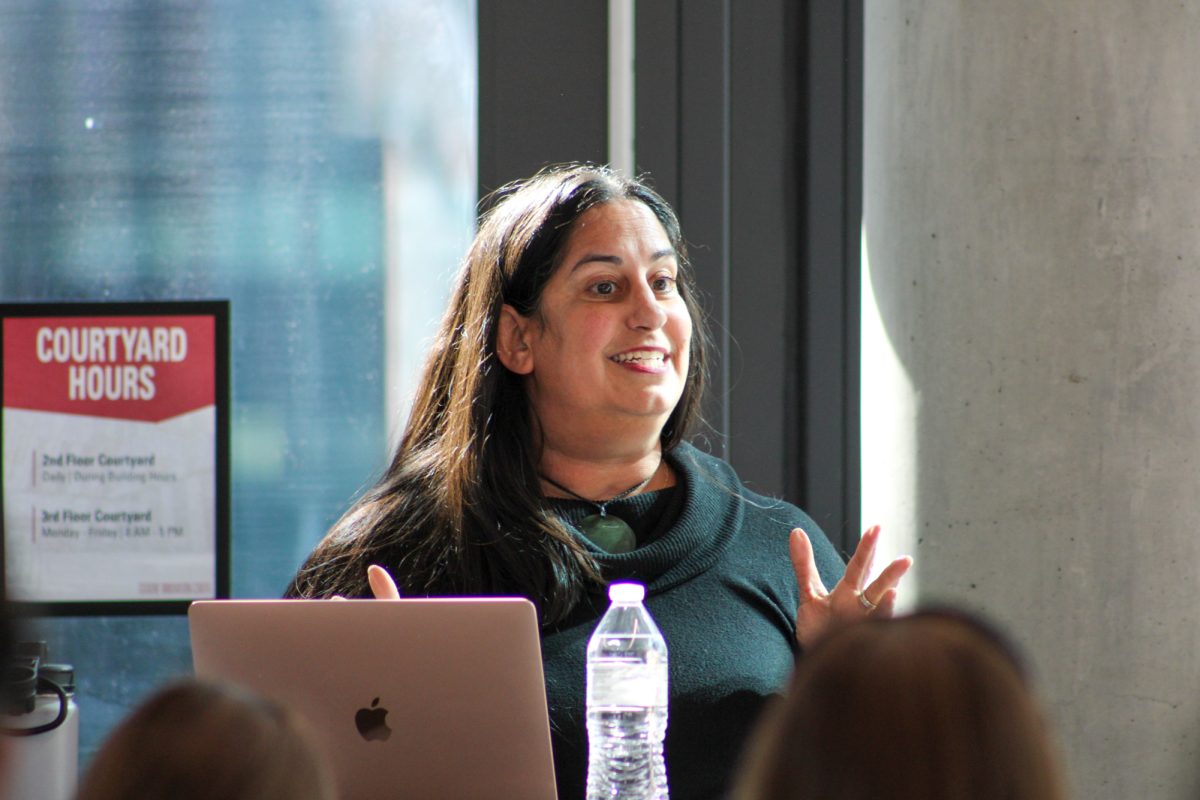
About 50 people gathered at 7 p.m. Tuesday at the Ames Public Library to hear Alan Wanamaker, associate professor of geological and atmospheric sciences, and Madelyn Mette, Ph.D. candidate of Iowa State’s department of geological and atmospheric sciences, talk about modern and future climate estimates/projections.
Wanamaker and Mette presented the second installment in the lecture series Behind the Science of Climate Change.
The event was hosted by Iowa State’s department of geological and atmospheric sciences and the National Science Foundation.
The lecture focused on analyzing climate anomalies through animations and graphs that depicted future projections of global and regional climate.
Mette began the night by speaking about modern climate and the instrumental record. Mette described the history of climate measurement and how observations are made, current trends in climate system and where to find climate data.
Beginning with the history of climate measurement, Mette introduced the thermometer. This was an early method developed in the 1600s to measure volume within change of gas or to measure temperatures. It wasn’t until the 1700s when a standard scale was used.
Nowadays, modern thermometers are now more sophisticated.
Mette also introduced the methods that are frequently used in the field to record climate. Automatic weather stations are often used to track wind and climate.
When setting up an automatic weather station it is important for the devices to be secluded so there are no variable interactions that could cause data to be skewed. Mauna Loa Observatory in Hilo, Hawaii, has a field station that collects data on CO2.
While they are prone to error, bucket measurements are common to measure climate in oceans. However, engine room intakes, ARGO floats and moored buoys are modern techniques used to take ocean temperatures and result in less error.
Measuring climate through ice measurements can be done through the use of satellites. Active and passive satellite sensors detect sea ice thickness.
“It is easier to measure a temperature change than it is to measure an absolute temperature,” Mette said.
Measuring in anomalies provides accurate data because they can effectively evaluate change in temperature and they are also good at taking into consideration differences that arise. Anomalies help compare between sites with different characteristics such as high/low elevation, close/far from cities and different styles of instruments.
Measurements of the atmosphere vary because of the array of places that have collections of data. Certain areas of the world aren’t as advanced as Europe and America, so more data is found in those locations. However, global coverage of station-based measurements increases through time.
“Another thing is with the oceans, we actually don’t need as many stations as we would for the atmosphere,” Mette said. “The ocean tends to change less from here to there — a certain distance. We have a pretty good idea of what ocean measurements are like. However, it drastically reduces overtime.”
Mette then addressed trends in global temperature. Since 1850-2012, the world has seen a rise in global temperature.
The northern hemisphere spring snow cover shows an important signal in changing precipitation and water dynamics over land. Arctic summer sea ice extent is declining. The global average of upper ocean heat content is increasing. Global average sea level is also increasing.
Atmospheric CO2 is also on the rise but is not as prominent in the southern hemisphere. Increasing ocean carbon dioxide concentration leads to decreasing ocean pH, which then will lead to acidification.
An animation was showed that outlined potential variables in an upward trend contributing to warming from 1880-1910. Orbital changes, solar, volcanic, natural factors, land use, ozone pollution, aerosol pollution and greenhouse gases were all viewed as potential causes for the upward trend.
It was determined that natural variations and human factors is ultimately the cause for the rise in climate.
“Scientists have a really good understanding of what would happen if the CO2 concentration was 450ppm, 600ppm or 1200ppm,” Wanamaker said. “We can model those easily. What we can’t do is tell you what path we’re going to take in the future. What we can do is cover our bases.”
Wanamaker proceeded to show a graph of a future projection that accounts for a 7.2 degree raise by 2100. Most of this warming will happen in the winters.
Wanamaker concluded the night by reflecting on the first and second installments of the lecture series.
“We looked into the past so we can place ourselves into a better framework both spatially and temporally so that we can understand that the changes that are happening now are both natural and human caused mainly through the emissions of greenhouse gases,” Wanamaker said. “We can use the climate models to predict or suggest what various scenarios may give us in terms of warmer variability, precipitation, temperature and those types of dynamics. Like anything, climate models are a tool and they’re being evaluated and improved all the time.”
The final installment of the Behind the Science of Climate Change lectures will take place at 7 p.m. May 3 and include a panel discussion.


