Joynt: New software visualizes greenhouse gas emissions
http://siliconangle.com/blog/2012/10/11/project-hestia-maps-carbon-emissions-at-street-level/
October 12, 2012
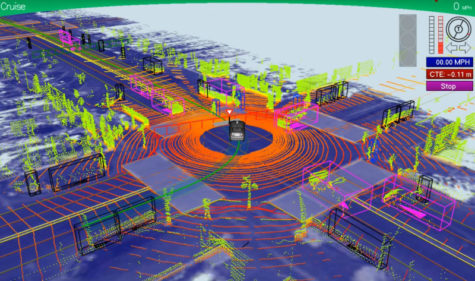
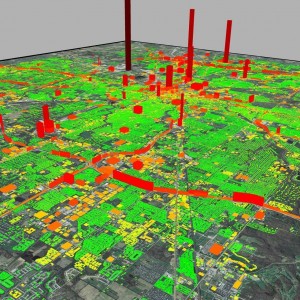
Greenhouse gas emissions can now be generated visually using high-resolution maps with a software package called Hestia. The software was developed by a team of researchers at Arizona State University.
Hestia estimates carbon dioxide emissions across entire city landscapes using sources such as local air pollution reports. Data collected from the sources is then used to quantify CO2 emissions, focusing on specific buildings and streets.
The software has been used in Indianapolis and work is currently being done in Los Angeles and Phoenix. Eventually, researchers hope to apply the software to other metropolitan areas in the U.S.
The detailed maps used in major cities will allow policy makers to research some of the most effective ways to reduce emissions in urban areas.
“Cities have had little information with which to guide reductions in greenhouse gas emissions – and you can’t reduce what you can’t measure,” said Kevin Gurney, an associate professor in ASU’s School of Life Sciences, and senior scientist with the Global Institute of Sustainability. “With Hestia, we can provide cities with a complete, three-dimensional picture of where, when and how carbon dioxide emissions are occurring.”
“As a community, we must take a leadership role in sustaining our relationship with the environment,” said ASU President Michael M. Crow. “This research, and its implications for global engagement regarding climate change, is an exciting step forward.”
The researchers will try to present data to officials across the country to address concerns about climate change. Starting out, there is an emphasis on reducing CO2 emissions at the local level, rather than changing entire industries.