The party of non-voters
Compared with likely voters, those who did not vote were found to be more likely to have less income and support Democrats more.
November 17, 2010
Voters ages 18 to 29 accounted for 11 percent of the overall vote nationwide in the 2010 midterm elections, while making up 34 percent of the overall non-voting population.
It is widely considered to have hurt Democrats nationwide, as 58 percent of those who did vote chose Democratic candidates. In 2008, 66 percent of those voters chose Barack Obama in the presidential election.
Travis Sullivan, senior in agricultural business, voted in 2008 but didn’t cast a ballot this year.
“I went to three different places [in 2008] and they told me to go to a different place, a different place and I got so frustrated with it,” Sullivan said. “By the time I got there to the place I was supposed to be at, the polls were closed and I was so fed up with it. And I guess I didn’t even want to go through with it this year.”
Poll workers said on election day they were having trouble with students showing up at the wrong polling location. They attributed it to a mix of confusion with satellite polling — where a person’s home address does not matter so long as they are in the right county — and students trying to vote in the same location they did in 2008, even though their address had changed since then.
They also said they saw only a fraction of interest as compared with 2008. Two years ago, lines were long and they routinely ran out of registration cards throughout the day. They described only a trickle of college students showed at polling stations on campus this November.
Alex Menard, senior in anthropology, followed the elections closely — she said she read multiple newspapers, watched it unfold on television and talked with friends.
“I’m not necessarily a [political] junkie. I should be more of a junkie, but I was just interested in what the results were because they’re important,” Menard said.
But Menard did not vote.
“I regret that I didn’t, but I didn’t feel that I was educated enough in the issues themselves before the race to be able to make an educated guess,” Menard said. “I think it’s very important to be informed before any election. I mean, I certainly should’ve worked harder to be informed but I didn’t want to go and vote blindly.”
Who the Non-Voters Are
Of non-voters, 60 percent had only a high school education or less, according to the Pew Center for Research. Only 16 percent actually graduated from college. Similarly, non-voters typically held a lower annual income.
The Hispanic population was far less likely to vote than any other racial demographic; they comprised only 6 percent of the likely voters and 21 percent of the non-voters.
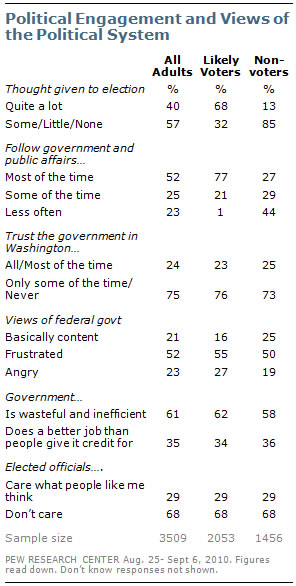
Non-voters were found by the Pew Center to be more liberal and lean more Democratic than likely voters, while also holding a much higher approval of President Obama’s performance.
Iowa State saw multiple visits from Democratic candidates, including local and statewide candidates like Gov. Chet Culver, Francis Thicke and Bill Maske. While Republicans Terry Branstad and Bill Northey did not visit campus, other Republicans like Sen. Charles Grassley and Tim Gartin did.
A clear majority of non-voters also approved of the health care insurance reform passed in March, as compared with a split of all adults.
The only poll question finding likely and unlikely voters in absolute agreement was 68 percent of each group agreeing with the sentence, “Elected officials don’t care what people like me think.”