Student Government election polling
Research conducted by Zachary Johnson
This poll was conducted by Zachary Johnson, a senior majoring in political science. The methodology for this survey involved sending out, via email, a survey to randomly selected students at Iowa State. Data was collected for 48 hours and then aggregated for each poll. We received 113, 156, and 67 respondents, respectively.
February 22, 2022
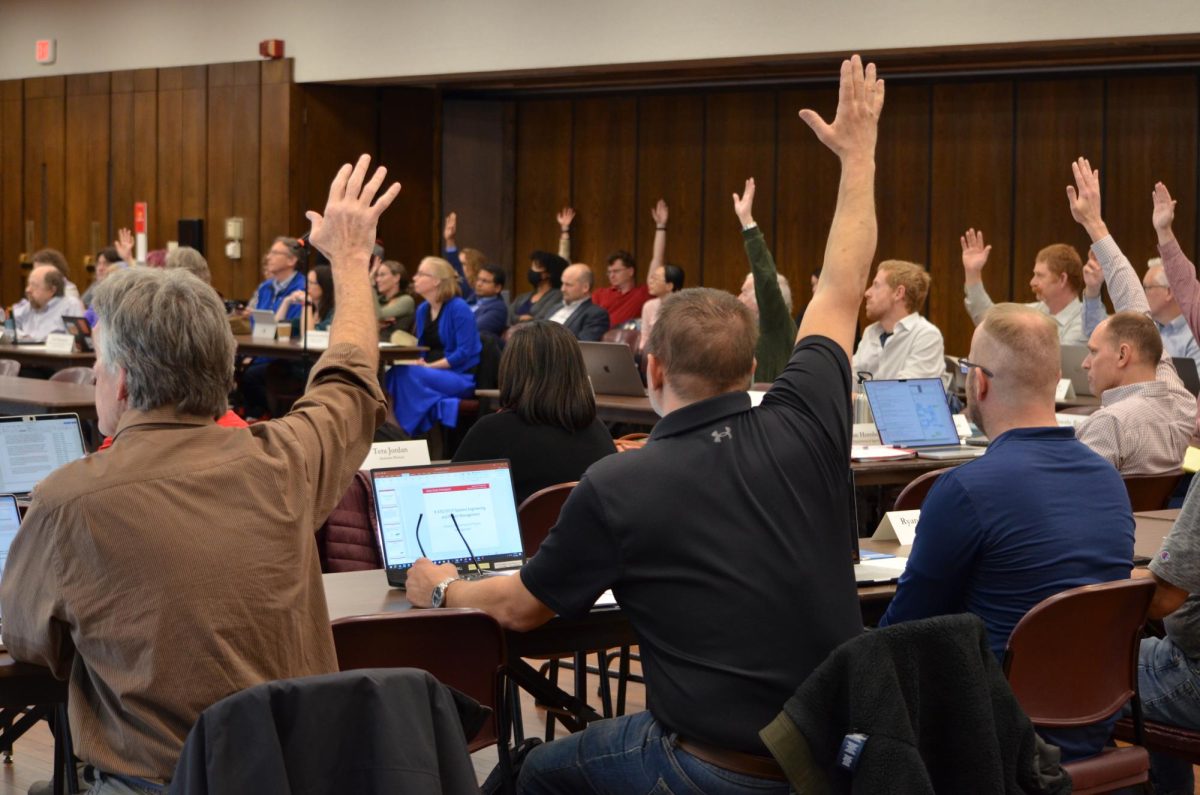
With the majority of Student Government Senate seats uncontested, based on a survey from the Political Science Department, the presidential race goes on to be the most followed race by the student body.
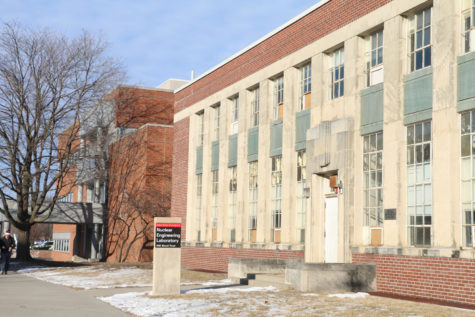
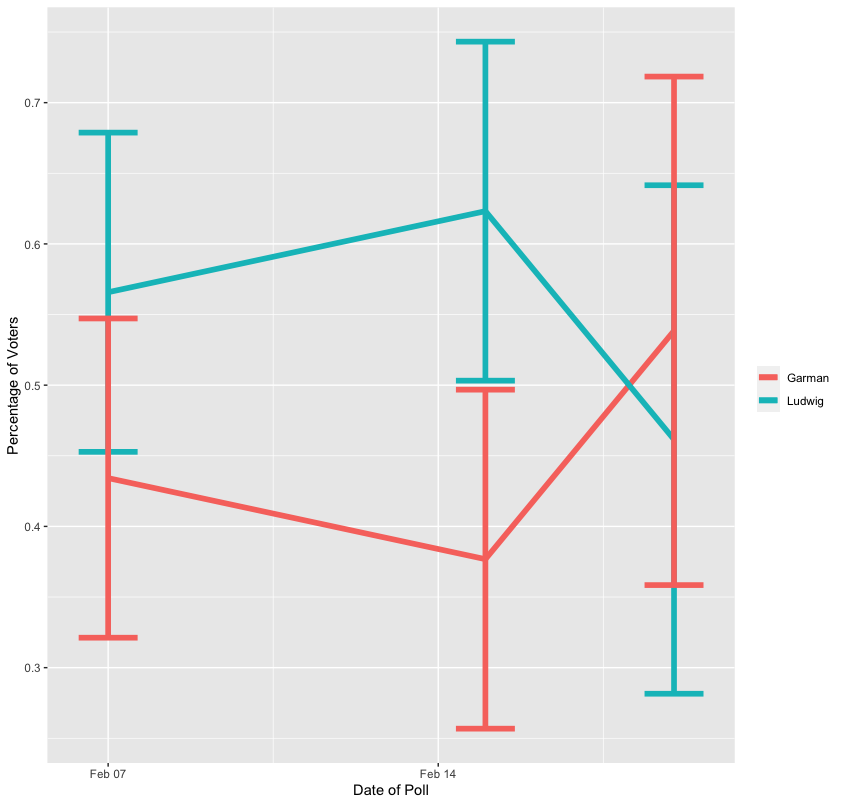
Though the most recent poll shows presidential candidate Bryce Garman, a senior in public relations, in the lead, the most reliable data collected on student perspectives of the race show that presidential candidate Jacob Ludwig is in the lead. Still, the majority of voters are either undecided or do not wish to make a decision. Ludwig, a senior in economics, sees most of his advantage among students in the Design and Engineering Colleges, with the latter, according to the data, being his most likely path to victory.
These error bars represent the statistical uncertainty that we see in only asking a small number of students compared to asking every student. The error, therefore, becomes larger when we have fewer respondents. This error is increased more so with the number of students who abstained. In the third survey, the results are very much non-conclusive and could vary by 18 percent in either direction.
Iowa State Student Government elections saw a historically high turnout in 2021, with 15 percent of students voting. However, this is not a large number of the student population. There is a large number of students who do not vote in these elections, and this large number of students could easily fundamentally change the state of the race.
The turnout for these surveys was the number of students who responded divided by 3000, so 3.76 percent, 5.2 percent, and 2.23 percent, respectively. These numbers reach only ⅓ as much as the record high we saw last year, but this is likely not a perfect estimate of turnout because of the unofficial nature of a survey email versus that of an actual ballot.
Three separate surveys were conducted to get a sense of the state of the race for Student Government positions. The first survey examined Student Government Senate seats in addition to the presidential race. These surveys were conducted by sending a Google form to 3,000 randomly selected Iowa State students.
Students were asked some demographic questions to help interpret how support for a candidate could be potentially correlated with these traits. The students were then asked which of the presidential slates they’d vote for. They were also given an option to write in a candidate or abstain from voting, with 56 percent of participants abstaining.
When the survey was conducted, all the Senate seats were contested. Currently, five out of 14 constituencies have contested races, including the College of Liberal Arts and Sciences, the College of Agriculture and Life Sciences, the Ivy College of Business, the Design College and Off-Campus Housing Students. The only real results from these surveys can be gleaned from students’ perceptions of the presidential race.
Ludwig’s advantage grew from the first to the second survey. This advantage is lost in the third survey, but reviewing the sample sizes of the votes could be an explanation for this.
With student engagement in Student Government being low, it is difficult to obtain a sample size that is sufficiently large and representative. The surveys, in order of when they were conducted, had 113, 156 and 67 respondents, respectively. This error explains this change in the lead.
These results should be taken with caution and the results from the second survey are, statistically speaking, the most conclusive in determining the state of the race as the confidence interval there has a gap of around a point. This indicates strong statistical evidence of Ludwig’s lead in the race.
In these surveys, given this low engagement rate, there is little chance that this edge is accounted for by anything but name recognition. The surveys were conducted in a way that the bump could also be interpreted in Ludwig’s numbers as the result of voter reactions to the vice presidential debate. This bump from one survey to the next is significant as it pulled the race to being in Ludwig’s favor out of the confidence interval. If the debate-bump theory has any merit, we might see things change after the presidential debate.
There are low numbers of students in design, making these numbers highly conducive to variability. The numbers that are of interest are Ludwig’s advantage among engineers. This seems to be what is fueling the Ludwig campaign’s overall advantage, according to these surveys.
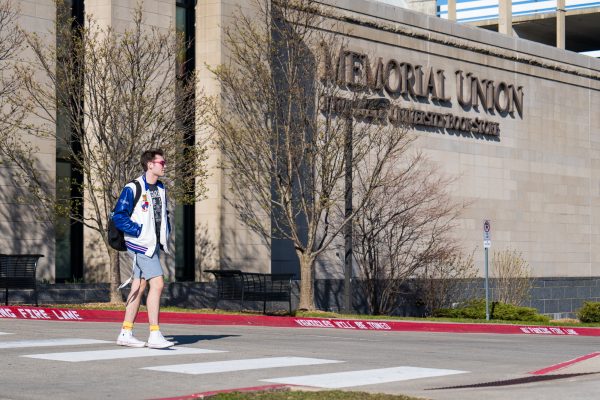
The Student Government presidential debate will be Feb. 23 in the Great Hall at the Memorial Union. Elections will take place March 1 and 2, and ballots will be emailed to students’ Iowa State emails.